Previous Story
Track how PPC performance changed when specific COVID-19 events took place
Posted On 13 Apr 2020
Comment: Off
This Google Ads script overlays government actions related to the pandemic on Google Ads performance metrics.
With my skills as a PPC expert, the best I can offer is to help people get clarity so they can make the best possible decisions in uncertain situations.
At Google, one of the core tenets of innovation was to share all information. The idea is simple: if you give smart people all information relevant to a situation, they will generally all work towards the same solution to solve the problem.
I’d like to do my part in helping advertisers get all the information in the form of a Google Ads script that overlays government actions related to the pandemic on Google Ads performance metrics.
The idea is to help you see if certain events, like store closures, the start of shelter in place, the closing of schools, or the introduction of social distancing correlates in any way with drop-offs or spikes in performance.

The time frame for which we have data for government action may be too short to see many meaningful patterns but I think the script has value because your boss or your client may ask you how COVID-19 is impacting their ads and this script can save you a couple of hours doing the work of manually compiling that data.
We’ve also heard feedback from our users at Optmyzr that this visualization has helped them because they serve customers in many locations and it’s challenging to stay on top of what is happening in all the different places where your customers may be advertising.
For this script, we are using a dataset from Kaggle with global government actions. It may not be complete or always up-to-date but it seemed like the best source for the data.
Installing the script is very simple. Just add it as a new script in your Google Ads account, add your email address to get notified when a new report is done, and schedule it to run once per day.

The script grabs geo-segmented account data for the past 30 days and adds it to a Google Sheet.
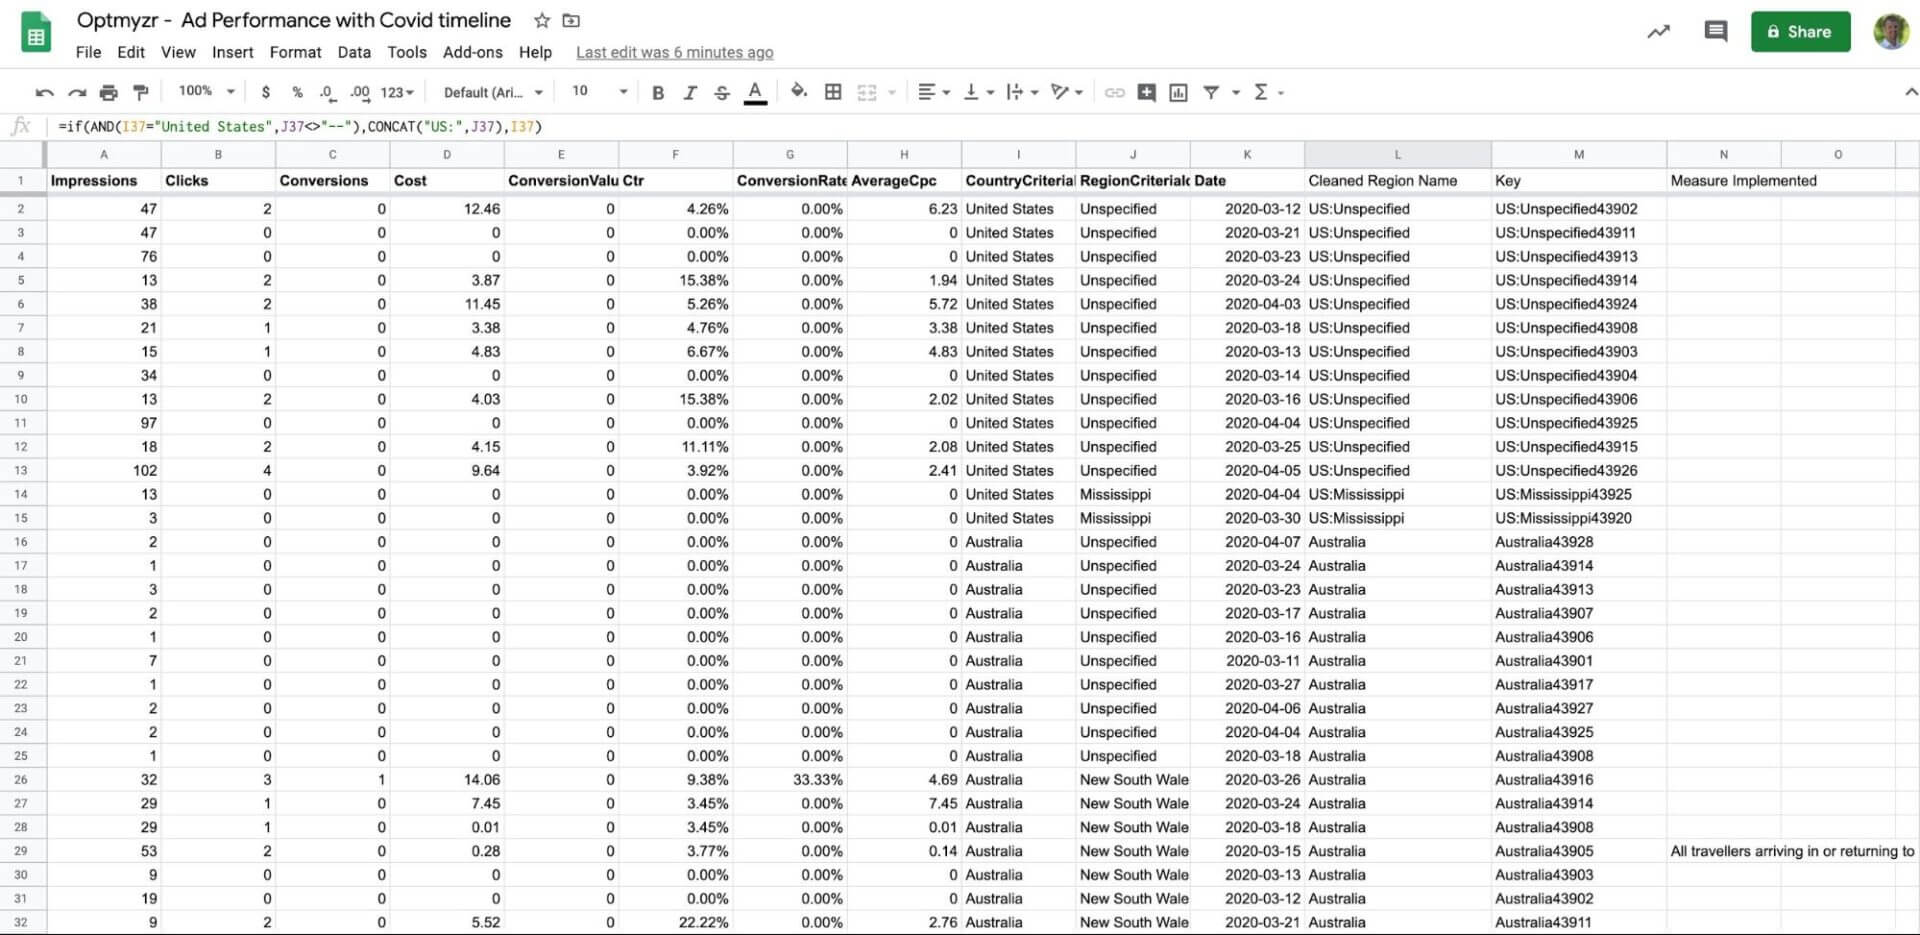
Then you can filter that data for the geo-location you want to see and the included chart will be updated automatically with just the metrics for that region and overlaid with just the government actions in that same region.

For the US, the data is most relevant at the state level. Internationally, the data is best at the country level.
Here’s the script:
| /****************************************** | |
| * Ad Performance With Covid Timeline | |
| * @version: 1.0 | |
| * @author: Naman Jindal (Optmyzr) | |
| * Event data courtsey epidemicforecasting.org used under the MIT license | |
| ********************************************/ | |
| // Select One Metric to plot on Chart from below | |
| // ‘Impressions’,’Clicks’,’Conversions’,’Cost’,’ConversionValue’,’Ctr’,’ConversionRate’,’AverageCpc’ | |
| var METRIC = ‘Impressions’; | |
| // Multiple emails separated by comma | |
| var EMAILS = ‘frederick@optmyzr.com’; | |
| // Do not edit below this line | |
| function main() { | |
| var cols = [ | |
| ‘Impressions’,’Clicks’,’Conversions’,’Cost’,’ConversionValue’,’Ctr’,’ConversionRate’, | |
| ‘AverageCpc’,’CountryCriteriaId’,’RegionCriteriaId’,’Date’ | |
| ]; | |
| var reportCols = [METRIC]; | |
| for(var k in cols) { | |
| if(cols[k] != METRIC) { | |
| reportCols.push(cols[k]); | |
| } | |
| } | |
| var query = [ | |
| ‘SELECT’, cols.join(‘,’), | |
| ‘FROM GEO_PERFORMANCE_REPORT’, | |
| ‘DURING LAST_30_DAYS’ | |
| ].join(‘ ‘); | |
| var TEMPLATE_URL = ‘https://docs.google.com/spreadsheets/d/18ir0O5RhyN5CeHFMD2Ns6vn6pMYxR5EKSQcP13n0zqQ/edit’; | |
| var template = SpreadsheetApp.openByUrl(TEMPLATE_URL); | |
| var ss = template.copy(AdsApp.currentAccount().getName() + ‘ – Ad Performance with Covid timeline’); | |
| Logger.log(ss.getUrl()); | |
| importCovidMeasures(ss); | |
| var tab = ss.getSheetByName(‘Ads Report’) | |
| AdsApp.report(query).exportToSheet(tab); | |
| tab.getRange(1,12,1,3).setValues([[‘Cleaned Region Name’, ‘Key’, ‘Measure Implemented’]]); | |
| tab.getRange(2,12,tab.getLastRow()-1,1).setFormula(“=if(AND(R[0]C[-3]=\”United States\”,R[0]C[-2]<>\”–\”),CONCAT(\”US:\”,R[0]C[-2]),R[0]C[-3])”) | |
| tab.getRange(2,13,tab.getLastRow()-1,1).setFormula(“=concat(R[0]C[-1],R[0]C[-2])”); | |
| tab.getRange(2,14,tab.getLastRow()-1,1).setFormula(“=IFERROR(vlookup(R[0]C[-1],’COVID 19 Containment measures’!$A$2:$G,7,false),\”\”)”); | |
| beacon(); | |
| if(EMAILS) { | |
| var sub = AdsApp.currentAccount().getName() + ‘ – Ad Performance Report with Covid timeline’; | |
| var msg = ‘Please find the report below:\n’ +ss.getUrl(); | |
| MailApp.sendEmail(EMAILS, sub, msg); | |
| ss.addEditors(EMAILS.split(‘,’)); | |
| } | |
| } | |
| function importCovidMeasures(ss) { | |
| var url = ‘https://docs.google.com/spreadsheets/d/150jU-coYaLMFhM-ctSrtRaLfFIFYo8vDGB2jideLiII/edit#gid=141150354’; | |
| var csv = SpreadsheetApp.openByUrl(url).getSheets()[0].getDataRange().getValues(); | |
| var tab = ss.getSheetByName(‘COVID 19 Containment measures’); | |
| tab.clearContents(); | |
| tab.getRange(1,2,csv.length,csv[0].length).setValues(csv); | |
| tab.getRange(‘A1’).setValue(‘Key’); | |
| tab.getRange(2,1,tab.getLastRow()-1,1).setFormulaR1C1(‘=CONCAT(R[0]C[3],R[0]C[4])’); | |
| } | |
| function beacon() { | |
| var TAG_ID = ‘UA-XXXXXXXX-X’; | |
| var CAMPAIGN_SOURCE = ‘scripts’; | |
| var CAMPAIGN_MEDIUM = ‘Covid Timeline v1’; | |
| var CAMPAIGN_NAME = AdsApp.currentAccount().getCustomerId(); | |
| //var DOMAIN_LINK = ‘http://’+HOSTNAME+PAGE; | |
| if(TAG_ID == ‘UA-XXXXXXXX-X’) { return; } | |
| //Pulled from: http://stackoverflow.com/questions/105034/how-to-create-a-guid-uuid-in-javascript | |
| var uuid = ‘xxxxxxxx-xxxx-4xxx-yxxx-xxxxxxxxxxxx’.replace(/[xy]/g, | |
| function(c) {var r = Math.random()*16|0,v=c==’x’?r:r&0x3|0x8;return v.toString(16);}); | |
| var url = ‘http://www.google-analytics.com/collect?’; | |
| var payload = { | |
| ‘v’:1,’tid’:TAG_ID,’cid’:uuid, | |
| ‘t’:’pageview’,’cs’:CAMPAIGN_SOURCE,’cm’:CAMPAIGN_MEDIUM,’cn’:CAMPAIGN_NAME | |
| }; | |
| var qs = ”; | |
| for(var key in payload) { | |
| qs += key + ‘=’ + encodeURIComponent(payload[key]) + ‘&’; | |
| } | |
| url += qs.substring(0,qs.length-1); | |
| UrlFetchApp.fetch(url); | |
| } |
Opinions expressed in this article are those of the guest author and not necessarily Search Engine Land. Staff authors are listed here.