12 SEO metrics to add to your digital PR measurement program
Uncover insights to better understand your audience, optimize content and quantify PR impact by adopting these essential SEO metrics.
1. Start with audience research
Audience research shows who customers are, what they search for and where to reach them.
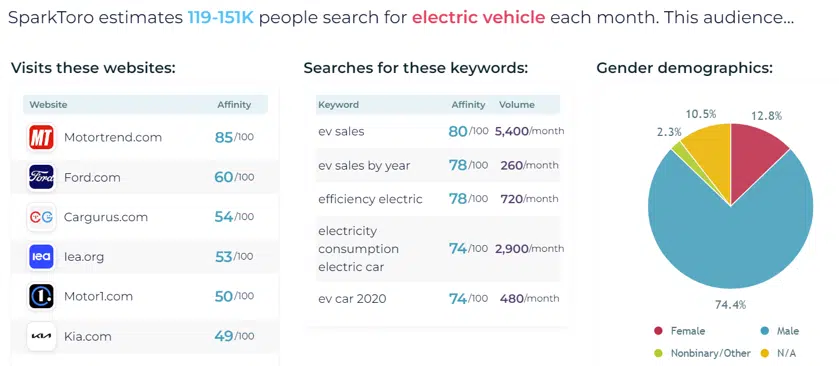
For example, you can use SparkToro V2 to discover that 119,000-151,000 people search for “electric vehicle” each month. The audience research tool shows you the websites they visit, the keywords they use and their demographics.

2. Conduct keyword research
Once you understand who your audience is, then you should conduct keyword research to measure search interest in a topic or search term.
For example, Google Trends tells PR people and SEOs what search terms people are searching for. Both groups can use this data to gauge search interest in a particular topic before they create relevant content.
We can also use the free Trends Explore tool. As you type your query, you will see a list of topics and search terms.
If a relevant topic appears in the drop-down list, then click on it to view the data. Otherwise, use the search term.
Topics are more dependable because they pull in the exact phrase and acronyms as well as cover all languages.
The Trends Explore tool displays “rising” and top search interest for related topics and queries.
“Rising” topics and queries have the largest increase in search interest over the previous period. The percentage increase in search interest is next to each topic or search term.
“Breakout” searches have increased by over 5,000% percent in the given time frame. Typically, these have been driven by breaking news stories or internet memes.
Top topics or queries have the highest search volume within the selected period. These are indexed and normalized values from 1-100.
3. Monitor share of search
Google Trends also enables you to measure share of search, which has become a key PR metric because it correlates to a greater share of website traffic.
For example, you can compare the share of search for up to five topics or terms like brands of electric vehicle.
This shows that the Tesla, Ford, Toyota and Chevy brands of electric vehicle have seen their share of search decline over the past 12 months, while BMW has seen its share climb.

4. Compare release views
PR people should question how many “release views” they are getting. Some of these views may be coming from bots, spiders and crawlers – including Googlebot.
As an alternative, they could use SparkToro’s audience research tool, which estimates:
- 12 million people visit prnewswire.com each month.
- 6.2 million people visit businesswire.com each month.
- 3.4 million people visit globenewswire.com each month.
- 2 million people visit newsdirect.com each month.
5. Count link clicks
PR people should also question how many “link clicks” their press releases are getting. It is unclear if some press release distribution services are counting clicks on links from bots, spiders and crawlers – including Googlebot.
So, I recommend using Google’s Campaign URL Builder, which adds campaign parameters to your URLs to track link clicks to a landing page.
Just enter the website URL of the landing page for your PR campaign. Then, fill out fields marked with an asterisk. A campaign URL is generated for you. You can use this URL in your anchor text or shorten it with Bitly.
6. Track events
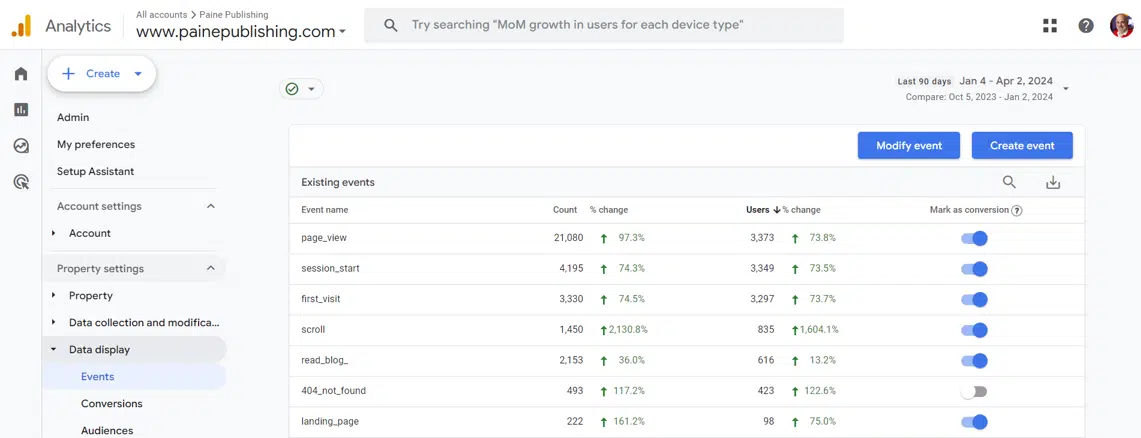
PR people should also use Google Analytics 4 (GA4) to track “events,” which measure specific behavioral interactions on their website.
For example, looking at events over the last 90 days shows PainePublishing.com that 835 users scrolled to bottom of pages 1,450 times and 616 read 2,153 blogs.

7. Measure key events
As I mentioned in Why the shift from ‘conversions’ to ‘key events’ in GA4 is a game changer, conversions have been renamed “key events,” so there’s a new term for the most important interactions on your website.
So, PR people at news or educational sites might consider these as key events:
- Scroll to 90% of a blog post or article.
- Play at least 50% of a product video.
- Complete a tutorial.
PR people at lead generation sites might consider these as key events:
- Download a white paper.
- Subscribe to a newsletter.
- Complete a registration form.
PR people at ecommerce businesses might consider these as key events:
- Begin the checkout process.
- Add merchandise to the shopping cart.
- Make a purchase.
8. Increase website traffic
While SEO managers and agencies should continue to use “organic search traffic” as metrics, communication professionals can use “referral traffic” and “organic social traffic” as PR metrics.
GA4 reports the websites users were on just before arriving at your site, showing the domain names of these sites as the sources of traffic.
The referral channel measures users who have arrived at your website via “editorial” links on other websites (e.g., blogs and news sites).
Organic social is the channel by which users arrive at your website via non-ad links on social sites like Facebook or X.
For example, referral traffic is the second-highest source of new users to PainePublishing.com and organic social is fourth.

9. Improve user engagement
PR and communication professionals – as well as SEOs – should add “improve user engagement” to their websites as metrics.
In GA4, “user engagement” and “engagement time” replace the old metrics of “bounce rate” and “time on site” in Universal Analytics (UA).
Now, bounce rate was a fundamentally flawed way to measure engagement. If someone visited your website, scrolled to 90% of a blog post or article and left without visiting any other pages, then that session was a bounce (single page impression) in UA.
But in GA4, engagement rate is the percentage of sessions that last longer than 10 seconds, have at least two pageviews or have a key event.
10. Raise brand awareness
If your company or client’s goal is to “raise brand awareness,” then you should use GA4’s Business objectives collection.
- The Demographic details report is a pre-made detail report that provides key characteristics about the people who use a website or app, including a user’s language, interests, location, age and gender.
- The Pages and screens report shows PR people data about the pages that users visited on their website and the screens users opened on their mobile app, enabling them to see where people are going across both these platforms.
11. Generate leads
If your company or client’s goal is to “generate leads,” then you should also use GA4’s Business objectives collection.
It includes a Landing page report, which helps you understand how visitors interact with your website. It displays the initial page visitors arrive at when they visit a website and indicates the number of visitors landing on each page.
This information can help PR people and SEOs identify which landing pages are performing well and which ones need improvement.
12. Drive online sales
If your company or client’s goal is to “drive online sales,” then you should also use GA4’s Business objectives collection.
- The Ecommerce purchases report shows you which products or services are being sold.
- The Purchase journey report shows how many users drop off at each step in the sales funnel.
- The Checkout journey report details the number and percentage of users who initiated and completed each successive step in the sales funnel on an ecommerce site.
